How can you trim the file size of ipynb which is so big that your kernel cannot open it?
I was working on multi-variate regression analysis. There were over 80 explanatory variables so I used the AIC (Akaike information criterion) with step function in order to reduce these. BTW, the AIC step function does not exist in Python so you have to write yourself.
qiita.com This guy wrote his own step function. I copied and pasted it in my ipynb.
def step_aic(model, exog, endog, **kwargs):
    """
    This select the best exogenous variables with AIC
    Both exog and endog values can be either str or list.
    (Endog list is for the Binomial family.)

    Note: This adopt only "forward" selection

    Args:
        model: model from statsmodels.formula.api
        exog (str or list): exogenous variables
        endog (str or list): endogenous variables
        kwargs: extra keyword argments for model (e.g., data, family)

    Returns:
        model: a model that seems to have the smallest AIC
    """

    # convert exog, endog to list format
    exog = np.r_[[exog]].flatten()
    endog = np.r_[[endog]].flatten()
    remaining = set(exog)
    selected = []  # contains adopted candidates

    # calculate AIC only for constants
    formula_head = ' + '.join(endog) + ' ~ '
    formula = formula_head + '1'
    aic = model(formula=formula, **kwargs).fit().aic
    print('AIC: {}, formula: {}'.format(round(aic, 3), formula))

    current_score, best_new_score = np.ones(2) * aic

    # adopt all elements, or ends the loop if the AIC will not be improved although adding any elements
    while remaining and current_score == best_new_score:
        scores_with_candidates = []
        for candidate in remaining:

            # calculate the AIC when adding the remained elements one by one
            formula_tail = ' + '.join(selected + [candidate])
            formula = formula_head + formula_tail
            aic = model(formula=formula, **kwargs).fit().aic
            print('AIC: {}, formula: {}'.format(round(aic, 3), formula))

            scores_with_candidates.append((aic, candidate))

        # adopt the elements that improved the AIC most as the best candidate
        scores_with_candidates.sort()
        scores_with_candidates.reverse()
        best_new_score, best_candidate = scores_with_candidates.pop()

        # if adding a candinate reduces the AIC, add it as the determined candidates
        if best_new_score < current_score:
            remaining.remove(best_candidate)
            selected.append(best_candidate)
            current_score = best_new_score

    formula = formula_head + ' + '.join(selected)
    print('The best formula: {}'.format(formula))
    return model(formula, **kwargs).fit()
Here is the problem. "print('AIC: {}, formula: {}'.format(round(aic, 3), formula))" yeilds huge amount of text information on my notebook, which makes my file as big as 80 MB. Have you ever heard of 80 MB sized ipynb? Jupyter notebook cannot handle it and freezed. To solve this problem, you have to trim your ipynb. But how? Your local jupyter kernel cannot open it. I tried once to delete unnecessary part manually by opening ipynb in my editor (as a JSON file) but that forced me huge efforts.
My idea was to use Google Colab notebook. Colab can handle and open a big size file.
You can use Google Colab Notebooks for trimming outputs. I opened 83 MB ipynb file at Colab and Colab could handle it. From Colab GUI, you can choose the output cell you want to delete then get the file back to your local directory and reopen it. Eventually I trimmed the original file to the size of 2 MB in this way.
ブログタイトルを変更しました
今年2月から転職をし、病院から外資系企業に籍を移すことになりました。もう医療通訳で診察室に呼ばれることはなくなりましたが、その代わり海外のスタッフと英語でやり取りすることが日常的になり、ますます汗だくになっております。特にテレフォンカンファレンス(TC)で相手がインド英語やフランスなまりの英語だったりすると聞き取ることすら難しい状態です。データアナリストとして日々精進していきますので今後もよろしくお願いします。
現在の取得資格: 医療情報技師(2016年8月試験合格), 診療情報管理士(2018年2月試験合格、88期生)
あ、医療情報技師の点数取得どうしよう。医療情報学会行かないと…。その点、診療情報管理士は資格維持コストが無いので楽ですね。同期の皆さんよろしくお願いします。
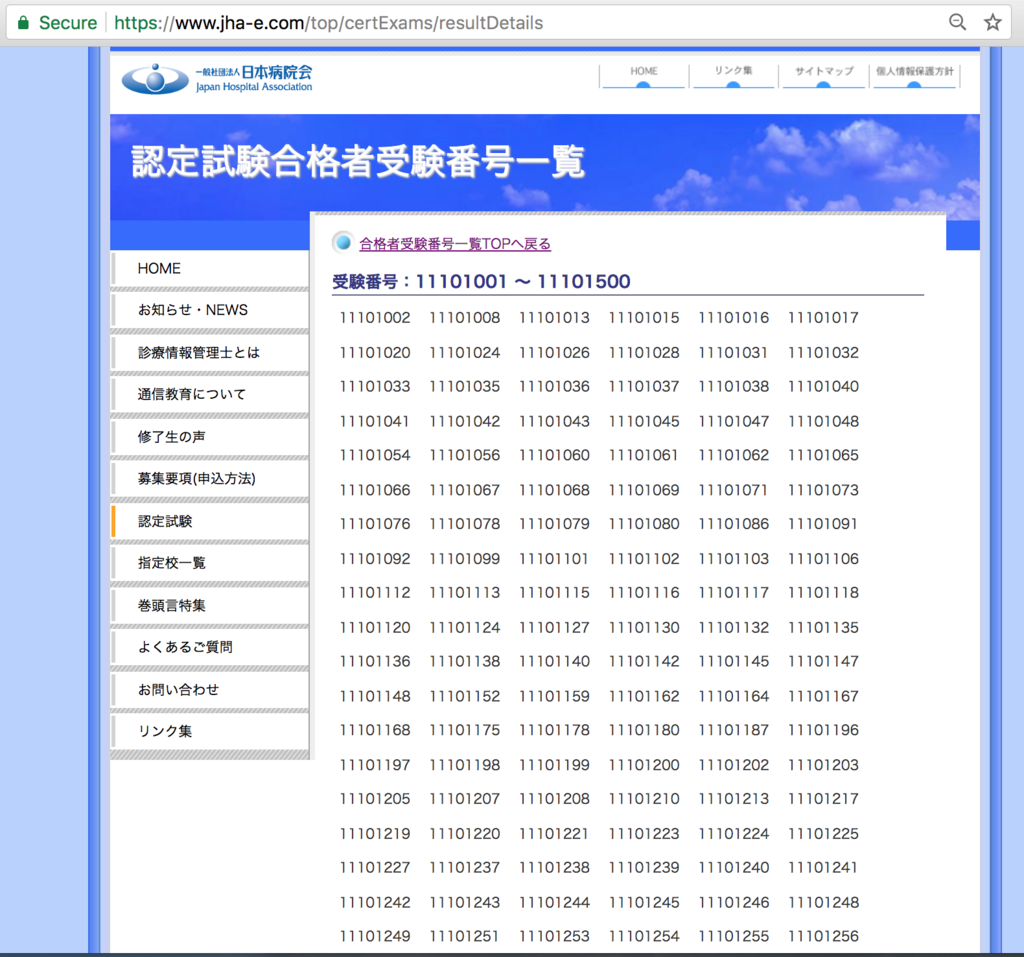
診療情報管理士認定試験の合格者受験番号一覧をPhantomJSでスクショしようとしたらブロックされた
3月23日に診療情報管理士認定試験の合格者受験番号が発表されました。認定試験のホームページに掲載されております。

よーし、こりゃあWebscrapingしがいがあるのー、ということで、小手調べにPhantomJSでスクリーショットを撮って見よー、と試して見たことろブロックがかかってしまいました。
from selenium import webdriver
from selenium.webdriver.common.keys import Keys as keys
import time

def main():
    url = "https://www.jha-e.com/top/certExams/resultDetails"

    driver = webdriver.PhantomJS()
    driver.get(url)

    print(driver.current_url)

    driver.save_screenshot("testnum.jpg")
    driver.quit()

    print("end")


if __name__ == '__main__':
    main()

やっぱセキュリティ気にしてるのかな?このはてなブログにリンク貼ることもできないようです。
ちなみにurlを一つ上の階層の"https://www.jha-e.com/top/certExams/result"にして見たらちゃんとスクショ撮れました。

Microsoft Translator Text API のcategoryを"generalnn"にすると翻訳精度が飛躍的に向上する
Microsoft Translator Text APIを自作のWebアプリに組み入れて翻訳させても翻訳精度が悪くて使い物にならない、というかiOSアプリや Androidアプリと翻訳結果が違っている、という状況に陥っていました。これについて日本マイクロソフトの中の人に直接問い合わせておりましたが、先日日本マイクロソフトの某パートナー企業の人からcategory="generalnn"にすると解消するという貴重な情報をいただき、その通りにすると改善しました。何も指定しない場合は、デフォルトのcategory="general"になるそうです。ちなみに"generalnn"の最後の"nn"というのはニューラル・ネットワークの事でしょうか? こちらに良い記事がありました。
おそらくデフォルトのcategory="general"は、統計学的機械翻訳を行うもので、category="generalnn"は、ディープ・ニューラル・ネットワークによる翻訳を行う、という事なのでしょう。
という事で、以前Githubに公開したライブラリにもcategory="generalnn"を加えておきました。
Microsoft Translator Text APIをPythonから手軽に使えるように実装した
Githubにあげました。 github.com
同様のライブラリはたくさん上がっていますが、Addtranslationメソッドをまともに使えるものが少なかったので自分で実装しました。 (Addtranslationメソッドとは、こういう風に訳してほしいという例文を送信して、次回以降の翻訳の精度を向上させる(カスタマイズする)機能です。)
使用例はこちら↓
医療通訳支援Webアプリ(The record system)にPlotlyから最近出たDashを使ってインタラクティブなグラフを追加した
以下のエントリーの続編です。
healthcareit-interpreter.hatenablog.com
herokuにデプロイしたページは以下になります。
https://englishtranslationrecord.herokuapp.com/
コードはGitHubにあげてあります。
①Dashのページのコード
②医療通訳支援Webアプリ(以下、Webアプリ)のコード
作成手順(概要)
1)Dashのページを作ってherokuにデプロイ
2)WebアプリにDashのページを埋め込む
という2段階になります。今回も前回に引き続き以下のページをベースに作業を進めました。
Making a Flask app using a PostgreSQL database and deploying to Heroku
それからDash用に以下も参照:
Dash User Guide and Documentation - Dash by Plotly
herokuに置いたDB(PostgreSQL)をDashのページとWebアプリとで共有する
参考にしたページ:
$ git init
$ git add .
$ git commit -m "initial commit"
$ heroku create etr-dashapp
$ git push heroku master
とした後に、データベースの手続きをします。ちなみにetr-dashappというのが今回新規作成するDashのページになります。今回はすでに展開してあったWebアプリ用のDBを使い回したいので、
$ heroku addons:attach englishtranslationrecord::DATABASE --app etr-dashapp

$ heroku pg:promote postgresql-hexagonal-12345 --app etr-dashapp
とやってあげます。englishtranslationrecordが既存のWebアプリの名称ということになります。
postgresql-hexagonal-12345はダミーの名称です。herokuのページ行くと確認できる、すでに展開してあるDBの名称になります。
すでに作成済みのDBを使い回すので以下の処理(herokuにDBを新規作成)は不要です。
$ heroku run python
>>> from app import db
>>> db.create_all()
>>> exit()
Procfileの中身
さて上記で、
$ git push heroku master
とやった時点でうまくいけば
https://etr-dashapp.herokuapp.com/
にDashのページが表示されるのですが、Procfileの書き方を間違えていたせいでHeroku deployment error H10 (App crashed)というエラーが出てしまいました。
↑ここにあるように
$ heroku restart
とか色々と試してみたのですがダメでした。頭を抱えた末にたどり着いたページに助けられました:
このページでは、Procfileの中身は以下のようになっていました。
web gunicorn run:server
うん? runというのはrun.pyのことか。serverというのはrun.py中に記載されたDashのインスタンスのことか。なら自分はdashapp.pyという名称にしていたので
web gunicorn dashapp:server
にしてみるか。動いた!jimmybowに感謝です。 でもよく見たら公式ページにもちゃんと書いてありました。
Procfile
web: gunicorn app:server
(Note that app refers to the filename app.py. server refers to the variable server inside that file).
Webアプリのデプロイのときは純flask製だったのでserverインスタンスではなくappインスタンスだった上、ファイル名称はapp.pyだったので
web: gunicorn app:app
だったとしてもよく分かっていなかったということが露呈した形になります。
app:appはapp.py:appインスタンスということだとようやく分かりました。
WebアプリにDashのページを埋め込む
さて話を本題に戻しましょう。Dashのページはflask本体のようにrender_templateメソッドを(現在のところ)使えないらしいので、
(参考:Dash itself won’t provide compatibility with Jinja templates.)
Webアプリ(flaskapp)がrender_templateするindex.html (ここではhome.html)などにiframeを組み込んで、herokuにデプロイしたDashのページのURLをsrcに指定してやる方法が一番簡単そうです。
ということで以下の修正をWebアプリ側に施しました。
<html>

<head>
</head>

<body>

<iframe frameborder='0' noresize='noresize' style='position: absolute; background: transparent; width: 100%; height:100%;' src="{{ iframe }}" frameborder="0" id="dash"></iframe>

<script type="text/javascript">
    window.onload = setInterval(function(){
        document.getElementById("dash").src = document.getElementById("dash").src
    }, 60*1000);
</script>

</body>

</html>
@app.route('/')
def home():
    iframe = 'https://etr-dashapp.herokuapp.com/'
    return render_template('home.html', iframe=iframe)
htmlファイルにはJavaScriptで60秒ごとにiframe部分限定のリロードをかけるように仕込んであります。 Dashのページはリロードする度にDBから最新データを取得するように関数化してあります。
def serve_layout():
    getdata()
    return html.Div([
        dcc.Dropdown(
            id='select-person',
            options=[{'label': i, 'value': i} for i in ffc.columns],
            multi=True,
            value=ffc.columns
        ),
        dcc.Graph(
            id='graph-with-range',
            animate=False
        ),
        dcc.Graph(
            id='my-table'
        ),
        dcc.RangeSlider(
            id='month-range',
            marks={str(i): i for i in ffc.index},
            min=ffc.index.min(),
            max=ffc.index.max(),
            value=[ffc.index.min(), ffc.index.max()],
            step=None
        )
    ])

app.layout = serve_layout
しかしDashのコードというのはPythonなのかJavaScriptなのか分からなくなりますね。(実際、HTMLとJavaScriptだけでインタラクティブなページを作ろうとするとこれほど短いコードでは済みませんが。)
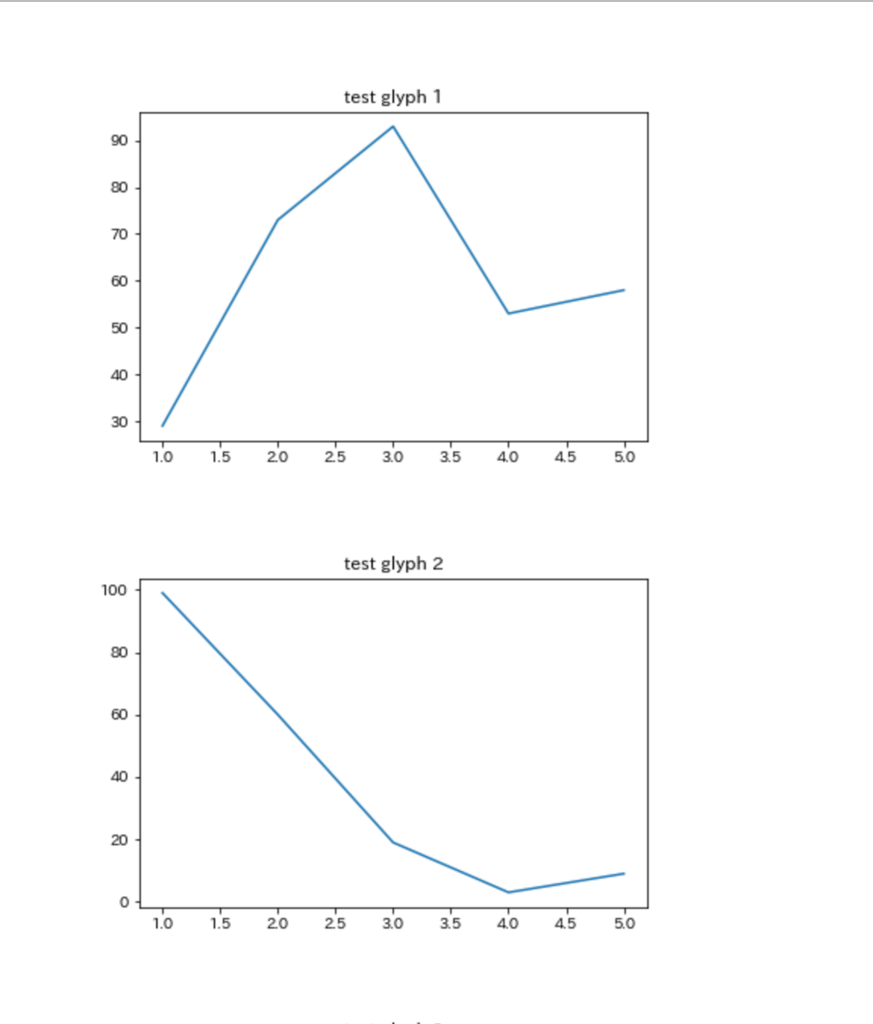
matplotlibで複数のグラフを作ったが、上司に報告するときExcelに貼り付けるってどうよ
患者統計(医事統計)の数字がおかしいので調べてくれ
という上司の命令に従い、渋々これまでの月別帳票(月別に別個のフォルダに格納されている)をPython標準ライブラリのglobとosを使って爆速で一括取得し、openpyxl で特定のセルだけ横串にしてmatplotlibで数値の月別変遷を見える化、したものの、
出来上がった複数のpngファイルをExcelに貼り付けて報告
という最後の落ちで笑えない状態になりました。せっかくjupyter notebookで作業してるんだから最後までスマートに行きたいものです。Excelにpngファイルを貼り付けって、結局手作業で画像の位置が微妙にずれたりして見た目にも美しくありません。
jupyter notebookからグラフを貼り付けたHTMLファイルを生成し、それで報告する
ここに同じような発想をしている人がいました。
スタンドアローンのHTMLファイルのソースコードを開いて、markdownで必要なテキストやデータテーブルを記載するというものです。これは素晴らしい! このスタンドアローンHTMLファイルをテンプレートにしてjupyter notebookからmatplotlibで生成したグラフをbase64形式にして貼り付ければ
糞Excel方眼紙を完全に駆逐
できます。pngファイルの残骸も発生することがありません。
ということでjupyter notebookに実装しました。
gistc542f40ad8221297a5c2436dbcceb410
matplotlibのグラフを任意の数だけを貼り付けたHTMLファイルがカレントディレクトリに生成されます。

このファイルをエディタで開いてmarkdown記載領域に必要な説明文を追加すれば以下のようになります。う、美しい!

はいサイナラExcel。